
Does the thought of building a financial forecast for your startup make your head spin? 😰 You’re not alone. Staring at a blank spreadsheet, trying to predict revenue, costs, and cash flow can feel overwhelming, especially when you’re not a finance expert. You know you need a credible financial forecast for startup success-to secure funding, guide your decisions, and prove your business model. But the fear of getting the numbers wrong and looking unprepared for investors is real.
Forget the stress and complexity. This guide is your step-by-step roadmap to building a professional, investor-ready financial forecast without the headaches. We’ll break down the entire process into simple, actionable steps. You’ll learn exactly what to include, how to base your assumptions in reality, and how to present your numbers with confidence. By the end, you won’t just have a spreadsheet; you’ll have a powerful tool to drive your startup’s growth and understand its true potential. Let’s build it together-the smart way. ✨
Key Takeaways
- Your financial forecast is more than just numbers-it’s the strategic roadmap for your growth and the proof investors need to see.
- Master the three core financial statements (Income, Cash Flow, Balance Sheet) to get a complete, 360-degree view of your business health.
- Learn the bottom-up method to build a credible financial forecast for startup success based on specific, defensible assumptions investors trust.
- Sidestep the 4 most common forecasting mistakes to save time and create a more accurate financial model from day one.
What is a Financial Forecast? (And Why It’s Your Startup’s GPS)
Think of a financial forecast as your startup’s GPS. It shows you where you are now, where you’re headed, and the resources you’ll need to get there. In simple terms, it’s your business’s story, told in numbers-a detailed prediction of your future revenues, expenses, and cash flow. It’s not a wild guess; it’s an educated estimate based on data, market research, and your strategic assumptions.
Your forecast serves two critical roles. Internally, it’s your strategic roadmap. Externally, it’s the proof investors and lenders need to see. A solid financial forecast for startup founders is non-negotiable; it’s the first thing a potential backer will ask for to validate your business model’s viability. And don’t confuse it with a budget. A budget is a plan for what you intend to spend, while a forecast is a prediction of what you expect to happen.
More Than Just a Fundraising Tool
While essential for securing capital, a forecast’s real power is in day-to-day decision-making. It transforms your goals from abstract ideas into concrete financial targets. It’s the tool that helps you:
- Guide strategic decisions: Can we afford that new hire? Is now the right time to double our marketing spend? Your forecast has the answers.
- Manage your cash runway: Know exactly how many months of operation you have left and when you need to act to avoid running out of funds.
- Set clear KPIs: Track your progress against your projections to see if you’re on target, celebrating wins and quickly correcting course when needed.
Key Timeframes: Your First 3-5 Years
The industry standard is a 3-5 year financial forecast. This timeframe is long enough to showcase your long-term vision but short enough to remain grounded in reality. However, the level of detail changes over time. Your model should use various forecasting methods to project with different levels of granularity:
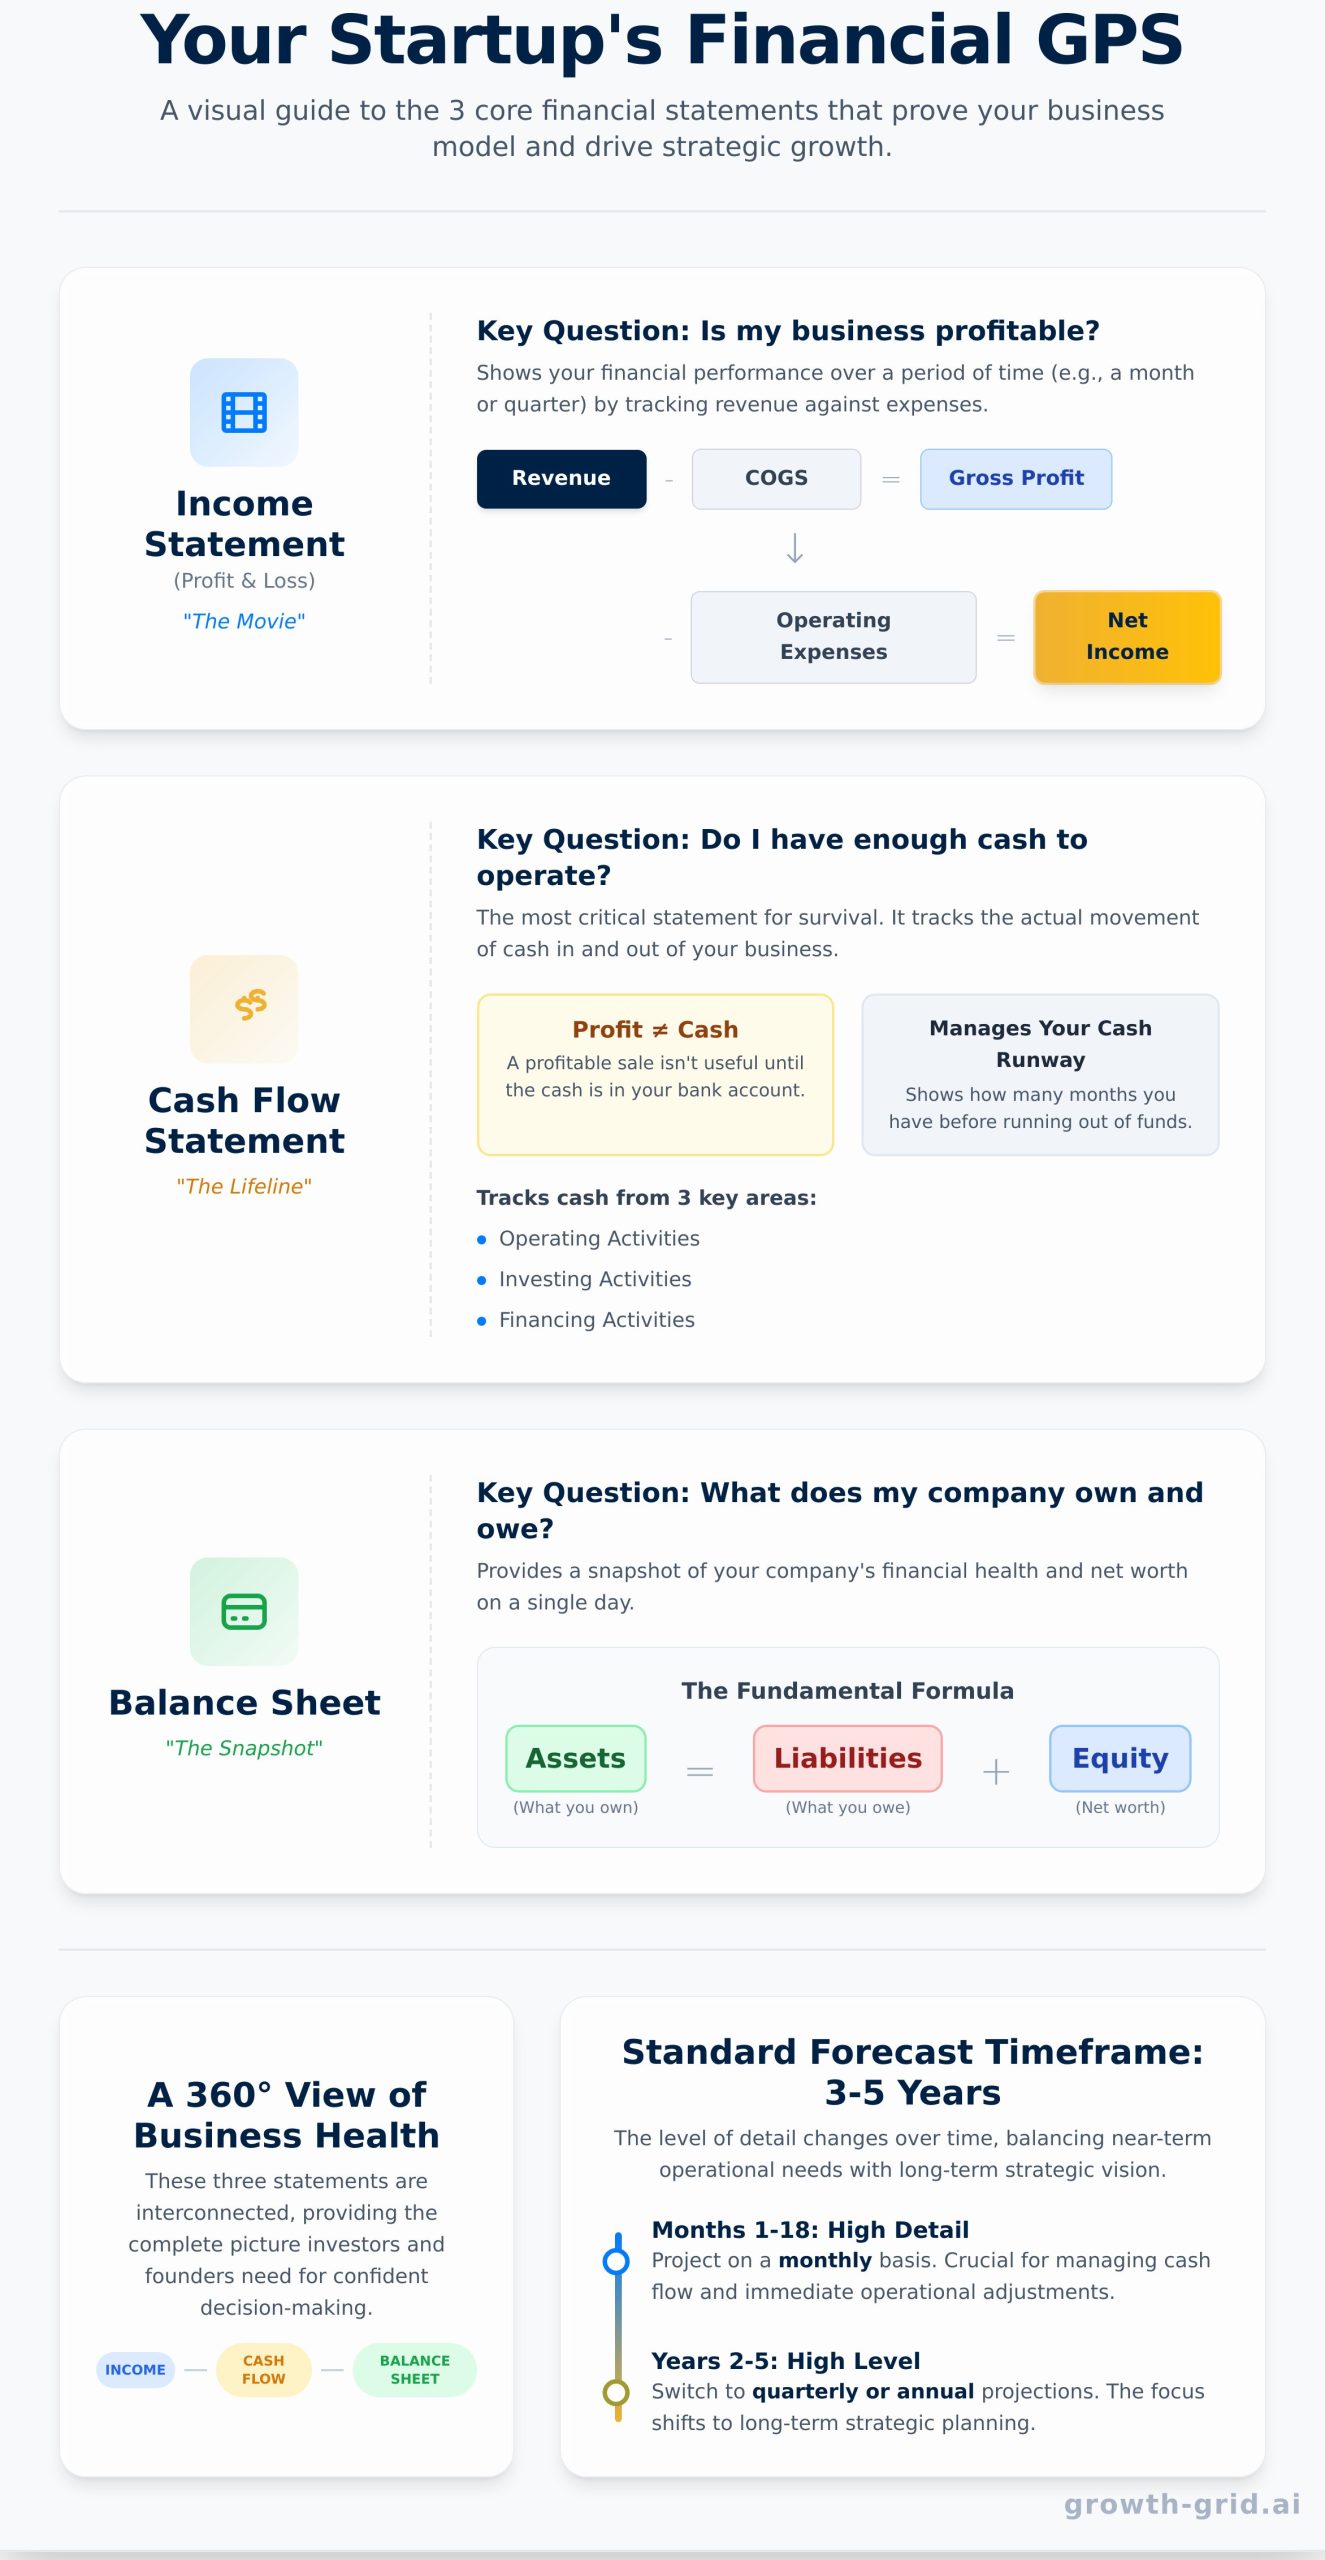
- Months 1-18: Project on a monthly basis. This high-detail view is crucial for managing cash flow and making immediate operational adjustments.
- Years 2-5: Switch to quarterly or even annual projections. As you look further into the future, the focus shifts from tactical management to high-level strategic planning.
The 3 Core Statements of Your Financial Forecast
Diving into financial statements can feel overwhelming. 😰 But don’t worry-you don’t need an accounting degree to get this right. Think of your financial forecast for a startup as three different camera angles on your business’s health. Together, they create the full picture investors and lenders need to see.
Here’s a simple way to remember the two most important statements:
- The Income Statement is like a movie, showing your performance over a period of time (e.g., a month or a quarter).
- The Balance Sheet is a snapshot, showing your financial position on a single day.
Let’s break down the “big three” so you can build them instantly.
The Income Statement (Profit & Loss)
This statement answers one critical question: Is my business profitable? It tracks your financial performance over time by subtracting costs and expenses from your revenue. Focus on these key lines:
- Revenue: All the money your business earns from sales.
- Cost of Goods Sold (COGS): The direct costs of creating your product or service.
- Gross Profit: Your Revenue minus COGS.
- Operating Expenses: Costs to run the business, like rent, marketing, and salaries.
What’s left after all expenses are paid is your Net Income-the famous “bottom line.”
The Cash Flow Statement
This is the most critical statement for survival. It answers: Do I have enough cash to operate? Profit doesn’t equal cash in the bank. You might have made a $10,000 sale (profit!), but if the invoice isn’t paid for 60 days, you don’t have the cash. This statement tracks the actual movement of cash through three areas: operating, investing, and financing activities. A healthy cash flow keeps the lights on.
The Balance Sheet
This statement provides a snapshot of your company’s net worth at a specific point in time. It answers: What does my company own and owe? It’s all based on a simple, powerful formula:
Assets = Liabilities + Equity
These three statements are the foundation of all solid financial projections for your business plan, providing the clarity needed for smart decisions. Here’s what each part means:
- Assets: What your company owns (e.g., your work laptop, cash in the bank).
- Liabilities: What your company owes (e.g., a small business loan, credit card debt).
- Equity: The value left over for the owners (Assets – Liabilities).
How to Build Your Forecast: A 5-Step Bottom-Up Method
Forget vague, top-down guesses like “we’ll capture 1% of the market.” Investors see right through them. The most practical and credible way to build a financial forecast for a startup is with a bottom-up approach. Why? Because it’s built on specific, defensible assumptions about your actual operations.
This method forces you to think like an operator, not a dreamer. You’ll connect your marketing activities to sales, your sales to costs, and your growth to your hiring plan. It’s the only way to create a forecast that tells a believable story. Let’s build it step-by-step.
Step 1: Forecast Your Sales & Revenue
Start with the drivers you can actually control. Instead of guessing a revenue number, calculate it. For an e-commerce or SaaS business, a simple formula is your foundation:
Website Traffic x Conversion Rate x Average Purchase Price = Revenue
Build your model based on realistic marketing plans and conversion data. It’s smart to create three scenarios: worst-case, realistic, and best-case. This shows investors you’ve considered risk and opportunity.
Step 2: Project Your Cost of Goods Sold (COGS)
COGS are the direct costs tied to producing or delivering your product. For a physical product, this includes raw materials and direct labor. For software, it might be server hosting fees, data APIs, or transaction fees. Calculating your COGS is critical because it determines your Gross Margin-a key indicator of your business’s profitability and scalability.
Step 3: Detail Your Operating Expenses (OpEx)
OpEx are the costs required to run your business, outside of COGS. These are your everyday expenses to keep the lights on and the business growing. They typically fall into two main buckets:
- SG&A (Sales, General & Administrative): This includes marketing spend, salaries for non-product staff, rent, software subscriptions, and legal fees.
- R&D (Research & Development): These are the costs to develop and improve your product, including salaries for your engineering team.
Step 4: Create a Headcount & Salary Plan
For most startups, payroll is the single largest expense, so it deserves its own step. Map out your hiring plan by role, projected start date, and base salary. Don’t forget to include the “fully-loaded” cost-add an extra 20-30% on top of salary to cover payroll taxes, insurance, and benefits. This is a common oversight that can wreck a forecast.
Step 5: Consolidate and Generate Your Statements
Finally, bring all your assumptions together. Your revenue forecast, COGS, OpEx, and hiring plan are the inputs that feed your three core financial statements. Manually connecting these moving parts in a spreadsheet is slow and full of risk. One broken formula can invalidate the entire model.
This is where your assumptions become a professional financial forecast for your startup. A smart tool can handle the complex connections instantly, ensuring accuracy and saving you days of frustration. Let AI build your financial statements in minutes.
Top-Down vs. Bottom-Up Forecasting: What Investors Want to See
When crafting your financial projections, you’ll face two main approaches: top-down and bottom-up. It’s not about choosing one over the other. Think of them as two essential tools that serve different, complementary purposes.
A winning business plan uses a detailed bottom-up forecast as its foundation, then uses a top-down analysis as a high-level “sanity check.” This powerful combination shows investors you are both ambitious and grounded in reality-a founder who dreams big but has a concrete plan to get there.
The Top-Down ‘Sanity Check’ 🔭
The top-down approach starts with the largest possible number-your Total Addressable Market (TAM)-and works its way down. You estimate the percentage of that massive market you can realistically capture over time. This method is incredibly useful for one key thing: showing investors the sheer scale of the opportunity. It answers the question, “How big can this possibly get?”
Warning: Never use this as your primary forecasting method. Simply stating “we’ll capture 1% of a $20 billion market” is a huge red flag for any serious investor. It shows a lack of tactical planning.
The Bottom-Up ‘Credibility Builder’ 🧱
This is where you earn your credibility. The bottom-up method is the core of a believable financial forecast for startup success. It starts with your actual, real-world operational capacity and builds your revenue forecast from the ground up. It’s based on tangible business drivers you can control and measure.
- ✓ Example (SaaS): “Our two sales reps can each make 50 calls a day, and our historical conversion rate is 2%. That means we can close two new deals per day.”
- ✓ Example (E-commerce): “Our marketing budget will drive 10,000 website visitors per month. With a 3% conversion rate and a $50 average order value, we project $15,000 in monthly revenue.”
This is the forecast you will be judged on. It proves you have a realistic, data-driven plan to achieve your goals.
Ultimately, your top-down numbers show the size of the prize, while your bottom-up forecast provides the step-by-step map to win it. Getting this balance right is critical for securing funding. Need to build a professional, investor-ready forecast fast? The tools at GrowthGrid can generate your complete financial plan in minutes, saving you weeks of work.
Avoid These 4 Common Forecasting Mistakes (The Smart Way)
Every founder makes assumptions that turn out to be wrong. That’s part of the journey. But some mistakes are entirely avoidable-unforced errors that can damage your credibility with investors. A solid financial forecast for startup success is about anticipating these pitfalls and building a plan grounded in reality.
Learn from others so you can focus on what matters: growing your business.
Mistake 1: The Unrealistic ‘Hockey Stick’ Growth
Investors have seen thousands of ‘hockey stick’ graphs promising explosive, overnight growth. It’s a red flag. Instead of just showing a steep curve, tie your growth to tangible drivers. For example: “We will hire 3 new salespeople in Q3, each expected to close 5 deals per month, which drives our revenue growth.” Show your work; don’t just state the result.
Mistake 2: Forgetting That Cash is King
Profitability on paper means nothing if you don’t have cash in the bank to pay your bills. This is a classic startup trap. Late-paying customers (accounts receivable), inventory costs, and loan repayments can drain your cash reserves even when you’re ‘profitable’. Your cash flow forecast isn’t an afterthought; it’s your early warning system.
Mistake 3: Underestimating Costs
Optimism is a founder’s superpower, but it can be a liability when it comes to expenses. It’s easy to forget the ‘hidden’ costs that add up fast: payroll taxes, employee benefits, software subscriptions, and professional fees. A smart move? Add a 10-15% contingency buffer to your expense forecast for the inevitable surprises.
The Old Way vs. The Smart Way
Building your financial forecast for startup capital doesn’t have to be a nightmare. You have a choice.
- The Old Way 😰: Wasting hours fighting with broken Excel formulas and guessing at the right structure, only to miss key sections investors expect to see.
- The Smart Way ✨: Answering simple questions and letting AI generate a professional, comprehensive forecast in minutes, using a proven, investor-ready structure.
Ready to skip the spreadsheet stress and focus on strategy? Stop stressing over spreadsheets. Generate your forecast now.
From Complex to Confident: Your Next Steps
Building a robust financial forecast for your startup is no small task, but it’s the most critical step in turning your vision into a fundable reality. Remember, your forecast isn’t just a spreadsheet-it’s your strategic GPS. By adopting a detailed, bottom-up approach and avoiding common pitfalls, you create a credible narrative that investors will trust and respect. Once you have this in place, the next step is connecting with the right investment opportunities, a process that firms like BGS Capital specialize in.
The old way means wrestling with complex formulas for weeks. 😰 The smart way means getting it done in minutes. Why spend 40+ hours on something you can automate? Trusted by thousands of startups, GrowthGrid gives you the power to create a professional, accurate forecast instantly. It’s fast, efficient, and backed by our 100% Satisfaction Guarantee.
Generate Your Investor-Ready Financial Forecast in Minutes →
You have the big idea. Now, get the numbers to prove it.
Frequently Asked Questions
How far out should a startup forecast its financials?
Most investors expect a three-to-five-year financial forecast. Your first year should be detailed month-by-month to manage cash flow effectively. For years two through five, you can switch to quarterly or annual projections. This approach provides the granular detail needed for immediate operations while still showing a clear, long-term vision for growth. It’s the smart way to balance precision with strategic planning and meet investor expectations without getting lost in hypotheticals.
What’s the difference between a financial forecast and a financial model?
Think of it this way: a financial model is the engine, and the forecast is the destination. The model is your spreadsheet, filled with all the assumptions, formulas, and variables that drive your business. The forecast is the output-the polished Profit & Loss, Balance Sheet, and Cash Flow statements you present. Your model lets you test different scenarios instantly, while the forecast is your official prediction based on your chosen strategy.
How do I create a forecast if my startup is pre-revenue?
A pre-revenue forecast focuses on two things: expenses and drivers. First, meticulously detail your startup costs and monthly burn rate to calculate your cash runway. For revenue, use a bottom-up approach. Instead of a vague market share guess, base your numbers on specific actions, like ‘we will contact 100 leads per month with a 2% conversion rate.’ This makes your financial forecast for startup grounded and believable to investors.
What are the best tools for creating a financial forecast?
For speed and flexibility, spreadsheets like Google Sheets or Excel are excellent go-to tools, offering complete control. However, to save weeks of work and avoid common formula errors, investing in dedicated financial forecasting software can be a smart move. These specialized platforms often provide professional templates and automate complex calculations, helping you produce an investor-ready forecast in a fraction of the time and with significantly less stress.
How often should I update my financial forecast?
You should update your financial forecast monthly, or quarterly at a minimum. The goal is to compare your projections to your actual performance. This isn’t just an accounting exercise; it’s a vital strategic tool that helps you spot problems early, manage cash efficiently, and make faster, data-driven decisions. If you’re actively fundraising or in a high-growth phase, monthly updates are non-negotiable to stay on track.
What are ‘assumptions’ in a financial forecast and how do I make good ones?
Assumptions are the educated guesses that form the foundation of your forecast-metrics like customer conversion rates, pricing, or monthly churn. To make good ones, use real data: industry benchmarks, competitor analysis, or early test results. Avoid pulling numbers out of thin air. Document every assumption clearly. This transparency shows investors you’ve done your homework and built a credible plan for your business.