
Drowning in a sea of acronyms? CAC, LTV, MRR, Churn… it’s enough to make any founder’s head spin. Feeling overwhelmed by data is the old way of building a business. 😰 The smart way is focusing only on the metrics that actually drive growth and impress investors.
But how do you separate the signal from the noise? That’s where having clear key performance indicators examples becomes your startup’s superpower. It’s the difference between guessing what works and knowing what works, and it’s critical for creating a professional business plan that gets results.
This guide is your shortcut. Forget the complex spreadsheets and endless jargon. We’re giving you a manageable list of the 15+ most critical KPIs for every area of your business-from marketing to finance. You’ll get simple formulas, practical advice, and the confidence to measure what truly matters. Let’s make your numbers work for you. ✨
What Are KPIs? (And Why They’re Your Startup’s GPS)
Think of Key Performance Indicators (KPIs) as the vital signs for your business. They are the critical, measurable values that show you exactly how effectively your startup is achieving its most important objectives. While there are countless key performance indicators examples to choose from, a Performance indicator is essentially any quantifiable measure used to gauge success. Without them, you’re flying blind. With them, you have a real-time GPS guiding every decision.
Stop guessing if your business is healthy. It’s time to switch from gut feelings to data-driven facts.
✗ The Old Way: Guesswork 😰
- Relying on gut feelings to gauge business health.
- Making critical decisions based on assumptions.
- Struggling to prove traction to investors.
✓ The Smart Way: Data-Driven Direction ✨
- Using hard data to see what’s working (and what’s not).
- Steering your startup with precision and confidence.
- Presenting clear, compelling growth metrics to secure funding.
Investors don’t fund hunches; they fund progress. KPIs are the language of growth, turning your hard work into a clear story of traction that backers and stakeholders can understand instantly.
KPIs vs. Metrics: The Simple Difference
It’s a common point of confusion, but the difference is simple. All KPIs are metrics, but not all metrics are KPIs. A metric tracks a business process, while a KPI tracks performance against a strategic goal.
- Metric: Your car’s current speed (e.g., 60 mph).
- KPI: Reaching your destination on time (e.g., arriving by 5:00 PM).
The ‘SMART’ Way to Set Your KPIs
The best KPIs drive action, not just data collection. Use the SMART framework to ensure your goals are crystal clear: Specific, Measurable, Achievable, Relevant, and Time-bound. This simple check turns a vague wish into an actionable target.
- Vague Goal: “Improve sales.”
- SMART KPI: “Increase new monthly recurring revenue (MRR) by 15% in Q4 by signing 25 new enterprise clients.”
Essential Financial KPIs to Keep Your Startup Alive
Forget the complex spreadsheets and overwhelming dashboards. In the first one to two years, your startup’s survival depends on one thing: cash. Tracking your company’s financial lifeblood doesn’t have to be complicated. The right financial Key Performance Indicators (KPIs) give you instant clarity on your health and trajectory without the noise.
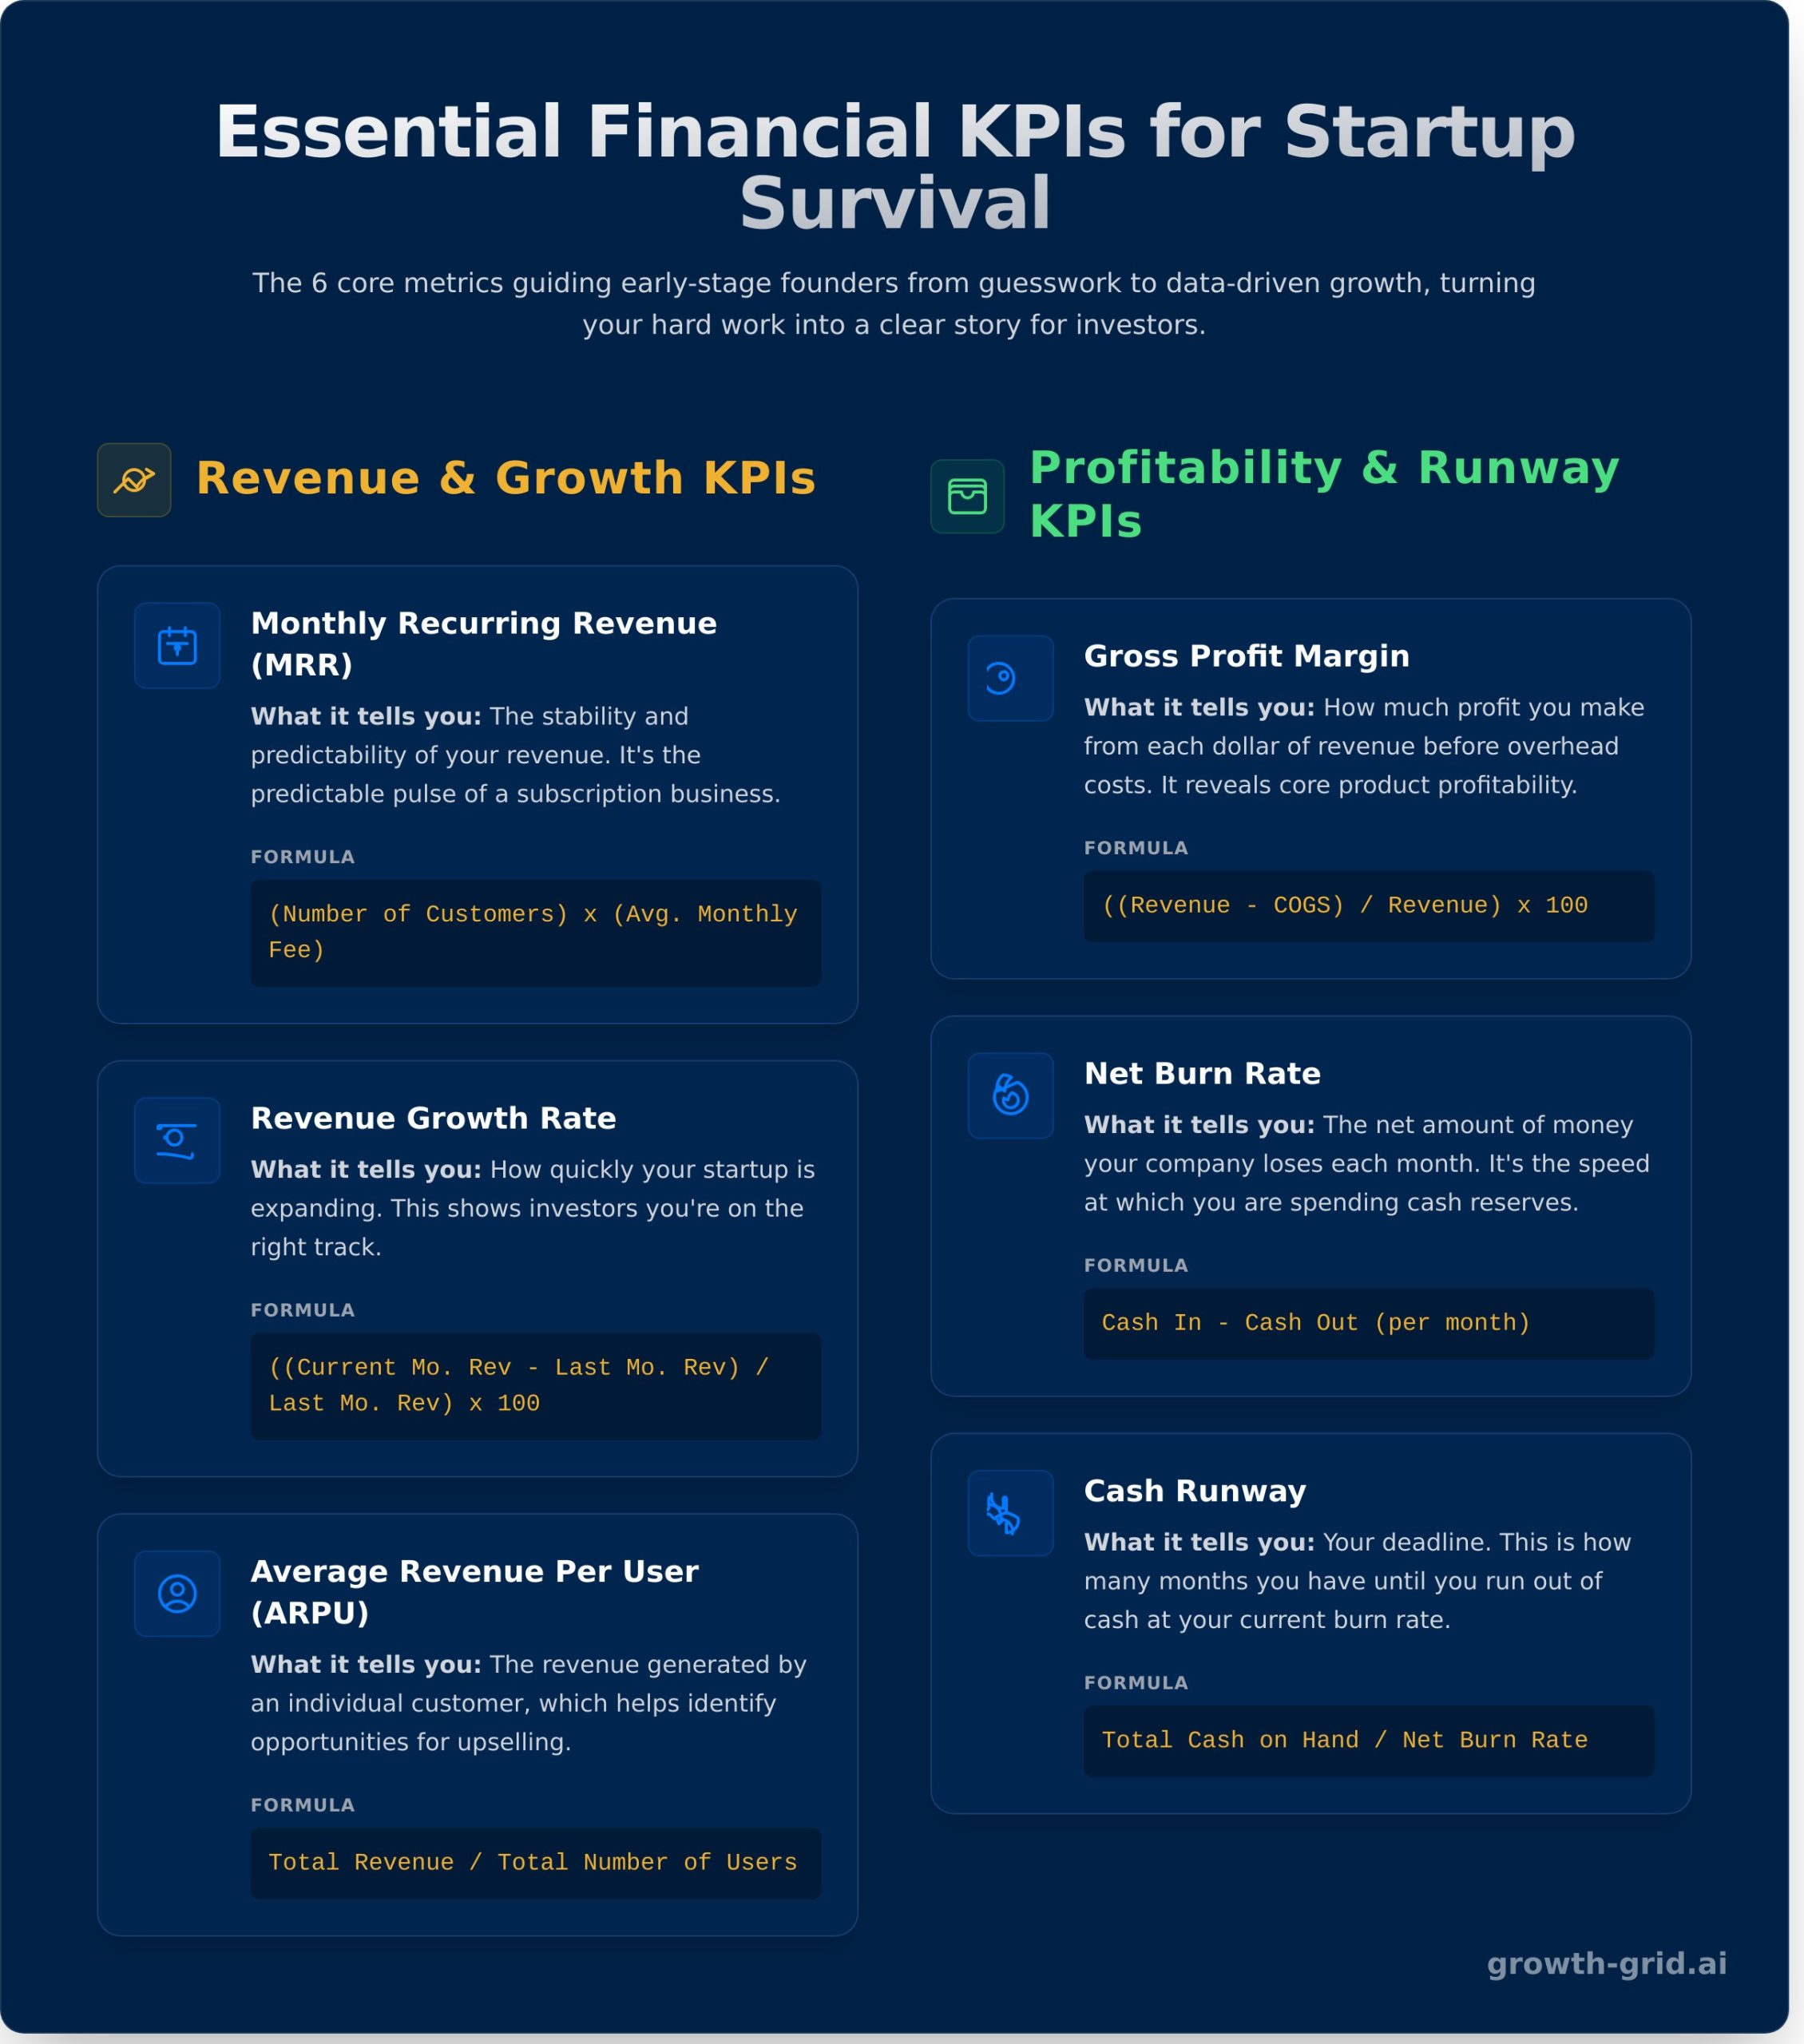
Focus on these six essential metrics. They provide a clear, actionable picture of your business, telling you what’s working and what needs fixing-fast. These are the most critical key performance indicators examples for any early-stage founder.
Revenue & Growth KPIs
These metrics prove that your business model is viable and that customers want what you’re selling. They are the ultimate proof of traction.
- Monthly Recurring Revenue (MRR): The predictable pulse of a subscription business. It smooths out one-time payments to show your consistent income stream.
Formula: (Number of Customers) x (Average Monthly Fee)
What it tells you: The stability and predictability of your revenue. - Revenue Growth Rate: This shows investors and your team that you’re on the right track. Consistent, positive growth is the goal.
Formula: ((Current Month Revenue – Last Month Revenue) / Last Month Revenue) x 100
What it tells you: How quickly your startup is expanding. - Average Revenue Per User (ARPU): This metric helps you understand the value of a typical customer and informs your pricing and marketing strategies.
Formula: Total Revenue / Total Number of Users
What it tells you: The revenue generated by an individual customer, which helps identify opportunities for upselling.
Profitability & Runway KPIs
Growth is exciting, but it means nothing if you run out of money. These KPIs are your survival dashboard, telling you how long you can operate before needing more cash.
- Gross Profit Margin: Are you making money on your core product? This metric strips away operating costs to reveal the fundamental profitability of what you sell.
Formula: ((Revenue – Cost of Goods Sold) / Revenue) x 100
What it tells you: How much profit you make from each dollar of revenue before overhead. - Net Burn Rate: This is the speed at which your company is spending its cash reserves. It’s the most honest look at your monthly cash flow.
Formula: Cash In – Cash Out (per month)
What it tells you: The net amount of money your company loses each month. - Cash Runway: The single most important survival metric. This tells you exactly how many months you have until your bank account hits zero at your current burn rate.
Formula: Total Cash on Hand / Net Burn Rate
What it tells you: Your deadline for reaching profitability or securing new funding.
Marketing & Sales KPIs: Measuring Your Customer Engine
A great product is useless without customers. Your marketing and sales engine is what attracts prospects and turns them into paying users. These KPIs tell you if that engine is running efficiently or burning cash without results. Stop guessing if your strategy is working-start measuring.
Tracking the right metrics shows you exactly where your go-to-market strategy is succeeding and where it’s failing. While there are dozens of metrics you could track, a solid understanding of the basics is essential. This comprehensive guide to Key Performance Indicators from Investopedia is a great starting point, but for startups, focus is everything. We’ve organized the most vital key performance indicators examples along a simple funnel to give you instant clarity.
Customer Acquisition KPIs
This is the top of your funnel. Are you attracting the right audience, and are you doing it affordably? These metrics provide the answer.
- Customer Acquisition Cost (CAC): This is the total cost of your sales and marketing efforts divided by the number of new customers acquired in a given period. Put simply: how much do you spend to win one customer? A high CAC can drain your startup fast.
- Website Traffic & Leads: Traffic is the number of visitors to your site; leads are the visitors who show interest (e.g., by signing up for a newsletter or a demo). This measures the raw volume your marketing generates. 📈
- Conversion Rate (Visitor-to-Lead): What percentage of website visitors become leads? A low rate might mean your messaging is unclear or your offer isn’t compelling enough. Fixing this is a fast way to get more from your existing traffic.
Sales & Customer Value KPIs
Once you have a lead’s attention, how good are you at closing the deal and creating long-term value? This is where your business model is proven.
- Lead-to-Customer Conversion Rate: Of all the qualified leads your marketing team generates, what percentage does your sales process convert into paying customers? This is the ultimate test of your sales effectiveness.
- Customer Lifetime Value (LTV): This metric predicts the total revenue a single customer will generate throughout their entire relationship with your company. A high LTV means you’re retaining customers who continue to see value in your product.
- LTV:CAC Ratio: ✨ The golden metric. This compares a customer’s lifetime value to their acquisition cost. A ratio of 3:1 (LTV is 3x CAC) is widely considered a benchmark for a sustainable, scalable business model. If your ratio is below 1:1, you’re losing money on every new customer.
Product & Operational KPIs: Is Your Business Running Smoothly?
Financial metrics tell you where you’ve been. Product and operational KPIs tell you where you’re going. These numbers measure the real-time health of your customer relationships and internal efficiency. They are your early warning system, helping you spot friction points for both your customers and your team long before they show up on the balance sheet. For many companies, formalizing this approach through a quality management system is a key step, and services like Align Quality specialize in implementing standards built around these exact types of metrics.
And for companies whose operational KPIs rely on data from multiple sources or even physical devices, having a unified system is crucial. To see how a modern data and IoT platform can help centralize this information, you can check out Pallax.
Tracking these metrics is non-negotiable for customer retention and long-term success. Stop guessing if your product is working. Start measuring. Here are the essential key performance indicators examples you need to monitor.
User Engagement & Product KPIs
Is your product a novelty or a necessity? These KPIs give you the answer by measuring how users actually interact with what you’ve built. A sticky product is the foundation of a healthy, growing startup.
- Daily/Monthly Active Users (DAU/MAU): This ratio shows how many of your monthly users engage with your product daily. A high DAU/MAU ratio (often 20%+) indicates a “sticky” product that has become part of a user’s routine.
- Customer Churn Rate: The percentage of customers who cancel or don’t renew their subscription over a given period. Your growth is meaningless if you can’t keep the customers you acquire. This is a direct measure of customer dissatisfaction.
- Net Promoter Score (NPS): Asks a simple question: “How likely are you to recommend our product to a friend?” NPS measures customer loyalty and predicts future growth by tracking your biggest fans (Promoters) and critics (Detractors).
Customer Support & Satisfaction KPIs
How do customers feel after they interact with your team? Great support can save a customer on the brink of churning, while poor support will drive them away-fast. These metrics are powerful leading indicators of future customer loyalty and churn.
- Customer Satisfaction Score (CSAT): A direct, instant measure of happiness. Typically, it asks, “How satisfied were you with this interaction?” on a 1-5 scale. It provides immediate feedback on specific support experiences.
- Average Ticket Resolution Time: How long does it take your team to solve a customer’s problem from start to finish? A faster resolution time means less customer frustration and more operational efficiency. It’s a win-win.
These product and operational key performance indicators examples are the pulse of your business. They provide the actionable data you need to build a better product and a more efficient team, ensuring customers don’t just sign up-they stick around.
How to Add KPIs to Your Business Plan (Instantly)
You’ve done the hard work of outlining your vision. But without Key Performance Indicators (KPIs), a business plan is just a collection of ideas. It lacks the teeth to be a real strategic document. KPIs transform your goals into a measurable, data-driven roadmap that proves your concept is viable.
Investors don’t just want to hear your big idea; they want to see that you understand the mechanics of your business. They look for specific metrics in your executive summary, marketing strategy, and financial projections to confirm you’re focused on what truly drives growth. Adding them is the final, crucial step to a professional plan that commands attention.
Choosing the Right ‘North Star’ Metrics
Don’t overwhelm your plan with dozens of metrics. Start by selecting 3-5 core KPIs that define success for your entire business. From this list, choose one ‘North Star’ metric-the single number that best captures the core value you create. For a SaaS company, this might be Monthly Recurring Revenue (MRR). For an e-commerce store, it could be Customer Lifetime Value (CLTV). Avoid ‘vanity metrics’ like social media followers that feel good but don’t impact your bottom line.
For a real-world example of a niche e-commerce store that would prioritize these metrics, you can visit Aggwings.
Let AI Define and Integrate Your KPIs
So, how do you find the right numbers without getting lost in spreadsheets for a week?
- The Old Way: ✗ Spending hours researching complex key performance indicators examples, building formulas, and manually plugging data into a template you found online. It’s slow, stressful, and easy to get wrong.
- The Smart Way: ✓ Answering simple questions about your business and letting AI suggest the most relevant KPIs for your industry. GrowthGrid’s platform not only identifies your metrics but automatically integrates them into your financial projections, creating a seamless, professional document in minutes.
Stop guessing and start building a plan that works. Let our AI do the heavy lifting so you can focus on what you do best-growing your business.
Generate a business plan with all the right KPIs in minutes. ✨
Turn Your KPIs Into Your Competitive Edge
Think of KPIs as your startup’s GPS. They aren’t just numbers to track; they are vital signs that guide your every strategic move. By combining financial, marketing, and operational metrics, you get a complete, 360-degree view of your business health. Understanding these key performance indicators examples is the critical first step, but the real power lies in using them to make smarter, faster decisions.
Ready to put these metrics into action? The most effective way is within a solid business plan. But why spend weeks stressing over spreadsheets? With GrowthGrid, you can create a 72-section, investor-ready business plan instantly. Join thousands of entrepreneurs worldwide who save over 40 hours of work and 90% on costs. Stop guessing and start building a data-driven future for your startup.
Stop guessing. Generate a data-driven business plan with AI now. →
Frequently Asked Questions
What are the 4 main types of KPIs?
KPIs generally fall into four core categories. Financial KPIs track your revenue and profitability-think Net Profit Margin. Customer KPIs measure satisfaction and loyalty, like Customer Lifetime Value (CLV). Process KPIs focus on operational efficiency, such as your sales conversion rate. Finally, People KPIs monitor team performance and satisfaction, like employee turnover rate. Focusing on these four areas gives you a complete, 360-degree view of your startup’s health.
How many KPIs should a small business or startup track?
Stop overwhelming yourself. A startup should focus on just 5-7 core KPIs. Any more than that creates noise and distracts from what truly matters for growth. Your goal is clarity, not complexity. Choose a primary KPI for each key business area-like marketing, sales, and operations-to maintain a laser-focus on your most critical objectives. This keeps your team aligned and your strategy on track without unnecessary data overload.
What is the difference between a leading and a lagging KPI?
Think of it like driving. Lagging KPIs are like looking in the rearview mirror-they measure past results. A great example is ‘Monthly Revenue.’ It tells you what you’ve already achieved. Leading KPIs are like looking at the road ahead-they predict future outcomes. An example is ‘Number of Sales Demos Booked.’ This metric helps you forecast future revenue. Smart startups track both to understand past performance and steer future success.
How do I create a simple KPI dashboard without expensive software?
You don’t need to spend thousands on fancy software. Create a powerful, free KPI dashboard using Google Sheets or a simple spreadsheet. List your 5-7 KPIs in one column and your weekly or monthly targets in the next. Use another column to track your actual results. Add simple charts and conditional formatting (e.g., green for ‘on target,’ red for ‘behind’) to make the data instantly scannable. It’s a fast, efficient, and zero-cost way to monitor your progress. For businesses that outgrow spreadsheets and need a tailored system, you can check out API Pilot for custom solutions.
Should my startup’s KPIs change over time?
Absolutely. Your KPIs must evolve with your business stage. An early-stage startup might focus on ‘User Sign-ups’ to validate an idea. Once you have a product, you might shift to ‘Monthly Active Users’ to measure engagement. Later, the focus could become ‘Customer Lifetime Value’ to ensure profitability. Sticking to the same metrics for too long is a mistake. Regularly review and update your KPIs to ensure they align with your current strategic goals.
What are some examples of ‘vanity metrics’ to avoid?
Vanity metrics look impressive but don’t actually impact your bottom line. Avoid tracking things like social media ‘likes,’ total page views, or the number of downloads for a free resource. While these numbers can feel good, they don’t tell you if you’re acquiring paying customers. Instead of these, focus on actionable key performance indicators examples like ‘Conversion Rate’ or ‘Customer Acquisition Cost (CAC)’ that directly measure business health and drive smart decisions.